External Figures
Figure 1: Porter’s Five Forces

Figure 2: Positioning Map

Figure 3: GE Multifactor Porfolio Matrix

Figure 4: Boston Consulting Group Matrix (BCG)
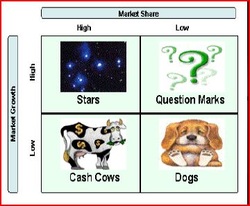
Figure 5: Determinants of Culture Model

Figure 6: Political Hierarchy
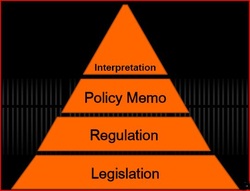
Figure 7: Dr. Rosenthal's Vector Model

Figure 8: Viral Marketing Effectiveness

Figure 9: International Product Life Cycle

Figure 10: Environmental Forces Model

Internal Figures
Figure 1: Organizational Strategy Chart

Figure 2: Supply Chain Flow Chat

Figure 3: QFIST

Figure 4: Dr. Rosenthal's 4P's Tool

Figure 5: General New Product Process

Figure 6: State-Gate Process

Figure 7: Dr. Rosenthal's Vector Model

Figure 8: Company Network Map

Market Positioning and Targeting Figures
Figure 1: Market-Product Grid

Figure 2: Positioning Map

Figure 3: Blue Ocean vs. Red Ocean

Figure 4: Steps in Segmenting and Targeting Model

Figure 5: VALS

Figure 6: Push/Pull Strategy Chart

Figure 7: Organizational Chart

Figure 8: The Consumer Decision Process Model

Figure 9: Buying Center Model

Figure 10: Influences on Decision Making Model

Figure 11: Maslow's Hierarchy of Needs

Figure 12: Perceptual Map

Figure 13: BCG Matrix

Marketing Planning
Figure 1: QFIST

Figure 2: Product Value Matrix

Figure 3: Product Lifecycle

Figure 4: Product Position Map

Figure 5: Servuction Model

Figure 6: Service Process Matrix

Figure 7: Break-even Analysis Chart

Figure 8: Experience Curve Pricing

Figure 9: Cross Elasticity of Demand

Figure 10: Four Approaches for Selecting Price

Figure 11: Eight Types of Selling

Figure 12: Baseball Model of Sales and Management

Figure 13: Five Elements of the Promotional Mix

Figure 14: Product Life-cycle Using Promotional Tools

Figure 15: Viral Marketing Model

Figure 16: Promotion Decision Process

Figure 17: Communication Process

Figure 18: Supply Chain Flow Chart

Figure 19: Channel of Distribution Model

Figure 20: Seven Principles of Supply Chain Management

Figure 21: Marketing Channel Intermediaries Model

Figure 22: Marketing Research Process

Figure 23: Dr. Rosenthal's Vector Model

